Metadata Netherlands
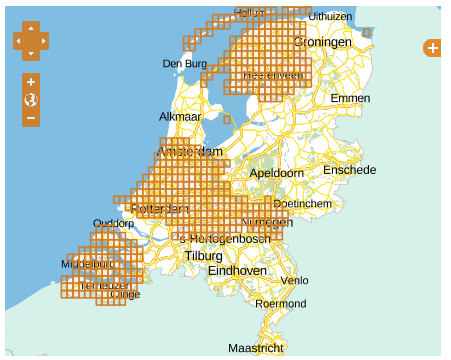
The actual dataset AHN3 (2014-2019) was not available for the whole area of the Netherlands (timestamp 5/2017).

Fig. 1: Coverage of the AHN3 dataset (link) in 5/2017.
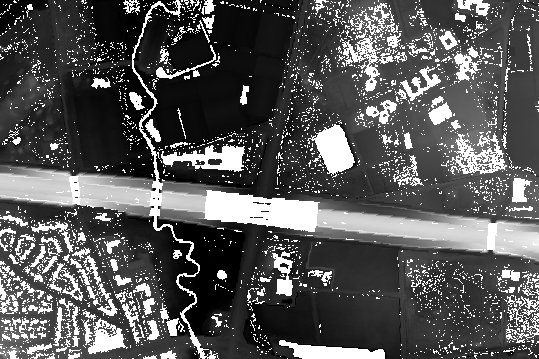
Unfortunately the processing of the AHN3 tiles is also not complete in every case (see figure 2 below). This makes an automatic processing impossible. Therefore only AHN2 data (2007-2012) was used.
Fig. 2: Incomplete AHN3 processing of tile 40GZ1. AHN3 in black/white, AHN2 in red.
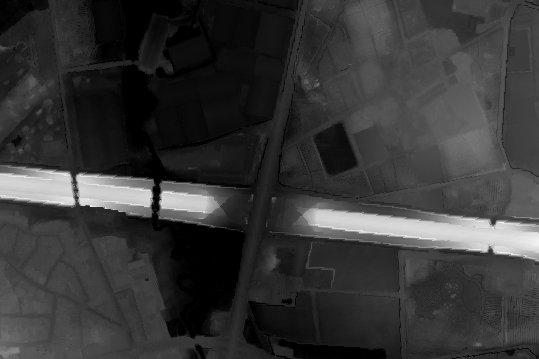
The shift of AHN2 in the Friesland / Groningen region is a known bug (see figure 3 below). Non-interpolated raster files were used in this case. Have a look at the coverage.png file for detailed information.
Fig. 3: AHN2 Bug in the area Friesland / Groningen region (tile 03gz2).
AHN3
| Data URL | Link |
| Metadata URL | Link |
| Horizontal Reference System | EPSG:28992 |
| Vertical Reference System | EPSG:5709 --> anschreiben |
| Resolution [m] | 0.5 |
| Distributor | Actueel Hoogtebestand Nederland (AHN) |
| License | CC0 1.0 |
| EVRF 2000 Offset [cm] | -1 |
Tab. 1: Basic data of the AHN3 dataset
AHN2
| Data URL | Link |
| Metadata URL | Link |
| Horizontal Reference System | EPSG:28992 |
| Vertical Reference System | EPSG:5709 --> anschreiben |
| Resolution [m] | 0.5 |
| Distributor | Actueel Hoogtebestand Nederland (AHN) |
| License | CC0 1.0 |
| EVRF 2000 Offset [cm] | -1 |
Tab. 2: Basic data of the AHN2 dataset
Even the filled dataset contains no data values for the buildings:

Fig. 2: Subset view of dataset i51gz1.tif with no data values in built-up areas.
These areas were filled by gdal_fillnodata with a maximum distance of 1000m, e.g.:
gdal_fillnodata -md 1000 -of GTiff i51gz1.tif filled\i51gz1.tif

Fig. 3: Subset view of dataset i51gz1.tif after the processing with gdal_fillnodata.
Be aware that this is only an approximation.
Unfortunately, the no data areas have the same no data value as the exceeded border regions. To avoid incorrect computed values in these areas, an opendata polygon of the Netherlands was used within the resampling tool to determine the no data areas, e.g.:
gdalwarp -dstnodata -9999 -q -cutline J:\landsgrens.shp -tr 1 1 -r cubic filled\i57gn2.tif filled\resampled\i57gn2.tif
By this processing step, the 0.5 m resolution of the original dataset was also resamled to 1 m resolution with cubic interpolation.
