Height measurements with GPS and barometer
Measuring heights with GPS and GPS internal barometers is a common issue. Here are some of our own measurements and thoughts on this issue.
The test case was a well known coordinate 46.5 m above sea level. The GPS was a GARMIN etrex VISTA HCX (which is for rent here). It was placed on a table 1 m above the ground, so the total height was about 47.5 m.
Tracks were recorded with an interval of 10 seconds. The GPS was not moved in any way.
First the GPS data were used for height calculation: System -> Altimeter -> Barometer mode set to "Fixed Elevation".
| Date | 19.6.2014 |
| Measurements | 2090 |
| Start Time | 11:02:34 |
| End Time | 17:56:53 |
| RMS North [m] | 6.805423 |
| RMS East [m] | 5.470128 |
| RMS Height [m] | 20.72875 |
Table 1: Settings and results for height calculation with GPS data.
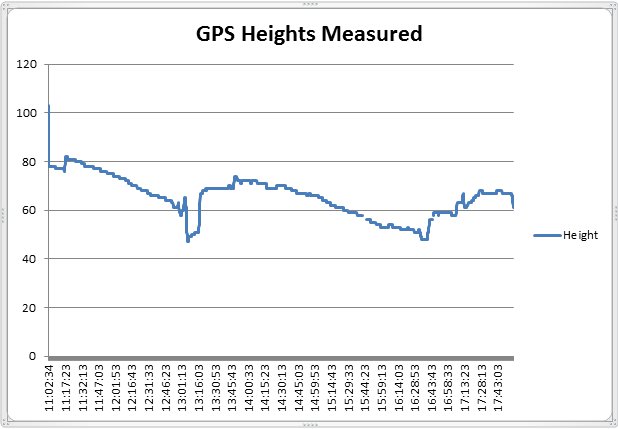
Fig. 1: Heights calculated from the GPS data over time[m], real height 47.5 m.
The height was clearly overestimated in almost all cases.
There was one approach to generate elevation models from GPS height measurements (see here). The conclusion was that it is possible to generate acceptable elevation models with a lot of data.
In the second case, the barometer modus was used to measure the height: System -> Altimeter -> Barometer mode set to "Variable Elevation". The barometer was calibrated at 47 m because it was not possible to enter decimals.
| Date | 19.7.2014 |
| Measurements | 4381 |
| Start Time | 07:53:27 |
| End Time | 20:03:32 |
| RMS North [m] | 8.123813 |
| RMS East [m] | 9.544973 |
| RMS Height [m] | 20.07382 |
| RMS Height after Correction [m] | 2.31649 |
Table 2: Settings and results for height calculation with GPS barometer.
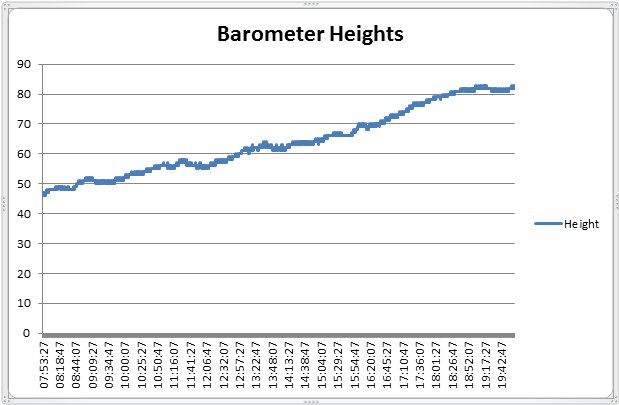
Fig. 2: Heights calculated from the GPS barometer over time[m], real height 47.5 meters.
On this bright, sunny day, the air pressure was falling, as seen in the following table. This results in an overestimation of the heights over time.
| Time | GPS [m] | Air Pressure at Cologne Airport [hPa] | Diff [hPa] | Corrected Height [m] |
| 8:00 | 47 | 1013.3 | ||
| 9:00 | 51 | 1012.9 | 0.4 | 47.8 |
| 10:00 | 52 | 1012.7 | 0.6 | 47.2 |
| 11.00 | 57 | 1012.1 | 1.2 | 47.4 |
| 12:00 | 56 | 1011.8 | 1.5 | 44 |
| 13:00 | 60 | 1011.3 | 2 | 44 |
| 14:00 | 62 | 1010.7 | 2.6 | 41.2 |
| 15:00 | 63 | 1010.6 | 2.7 | 41.4 |
| 16:00 | 68 | 1010.2 | 3.1 | 43.2 |
| 17:00 | 72 | 1009.7 | 3.6 | 43.2 |
| 18:00 | 78 | 1009.1 | 4.2 | 44.4 |
| 19:00 | 82 | 1008.6 | 4.7 | 44.4 |
| 20:00 | 83 | 1008.7 | 4.6 | 46.2 |
Table 3: GPS barometer measurements and corresponding data from the next weather station Cologne Airport (Wetter24).
One of the next weather stations near the coordinate was at the Cologne Airport (about 15 km). The air-pressure measurements from the weather station were used to correct the data from the GPS barometer (Table 3). The differences from hourly measured air pressures to the first measurement at the station were calculated (column “Diff”).
At this height above mean sea level, one could assume that the barometric scale factor is about 8 m (Wikipedia).
So, for example, at 18:00 the difference to the first measurement of the day was about 4.2 hPa. Multiplied by 8 m we get a correction factor of 33.6 m, which results in a corrected height of 44.4 m (78 - 33.6 = 44.4).
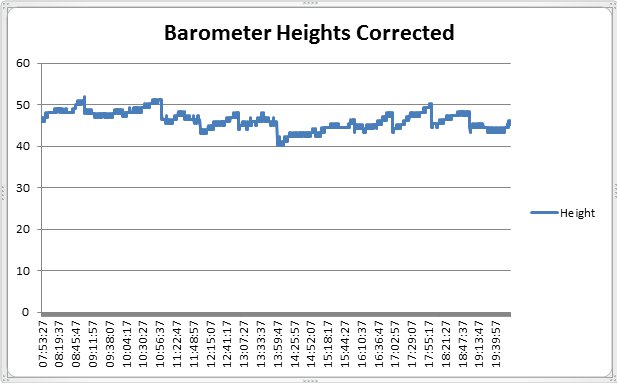
Fig. 3: Heights calculated from the GPS barometer after correction over time[m], real height 47.5 m.
Under stable weather conditions the GPS barometer with calibration is a good choice for height measurements. However air pressure is always changing (see Figure 4).
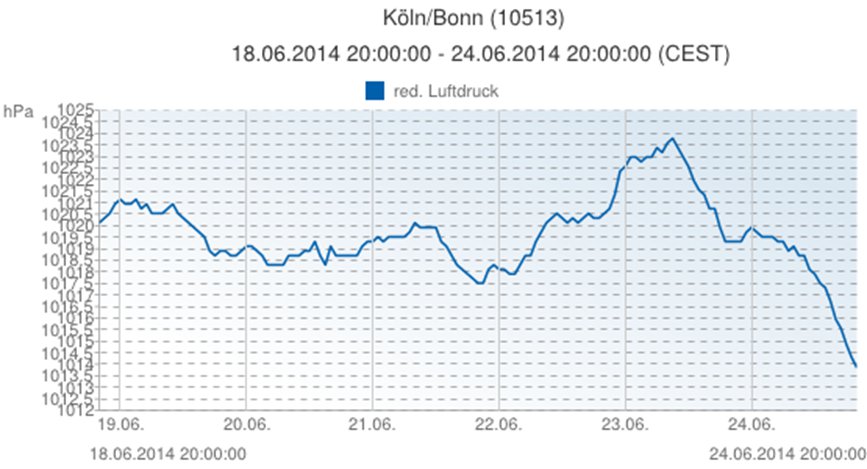
Fig. 4: Relative air pressure at the weather station at Cologne/Bonn Airport from 18.6.2012 untill 24.6.2014 (Wetter24).
Even under stable weather conditions, we have daily oscillations (circadian and semicircadian --> Wikipedia).
There are also other conditions which could lead to improper results:
- relief, e.g. at the
windward and leeward side of mountains
- atmospheric instability, e.g. thermal bubbles
- deviations from the standard atmosphäre, e.g. important for the calculation of the barometric scale factor
Conclusions
Neither approach is practicable to measure heights with a GPS in real life.
With the GPS barometer, calibration reference data and post-processing with data from an external barometer results with an RMS error of 2.5 m could be achieved here.
For successful crowdsourcing, the tools must be easy to access and simple to use.
Therefore, a mobile application for smartphones with barometers was developed (see here).