Download Bathymetry
GEBCO 2021
The same as for the 2019 dataset.
Download GEBCO 2021 derived raster classification
Download GEBCO 2021 derived contour lines
Download GEBCO 2021 derived contour polys (updated 24.01.2022)
Attributation: Derived product from the GEBCO 2021 Grid, made with NaturalEarth by OpenDEM
Download GEBCO 2021 derived contour lines clipped by OpenStreetMap water polygons (date: 14.07.2021)
Download GEBCO 2021 derived contour polys clipped by OpenStreetMap water polygons (updated 24.01.2022)
The data was split in 32 parts for processing reasons.
Attributation: Copyright 2021 OpenStreetMap contributors and GEBCO 2021 Grid (derived product). Available under the Open Database License (ODbL).
WMS (Raster & Contours clipped by NaturalEarth):
https://www.opendem.info/geoserver/opendem/wms
Layers: opendem:gebco_2021_contours & opendem:gebco_2021
Processing Polygons
For processing reasons, the dataset was split before processing in 32 parts. The processing was done with gdal:
gdal_contour -P -amin amin -amax amax -i 500 -fl -12000 -9500 -9000 -8500 -8000 -7500 -7000 -6500 -6000 -5500 -5000 -4500 -4000 -3500 -3000 -2500 -2000 -1750 -1500 -1250 -1000 -750 -500 -250 -200 -100 -50 -25 input.tif output.shp
Be aware that for the class -12000 - -9500 amin is shown as 0 and not -12000 after the processing. Of course, this was corrected later manually.
The dataset was clipped with ogr2ogr –clipdst to the Ocean dataset from Natural Earth or OSM Water polygons.
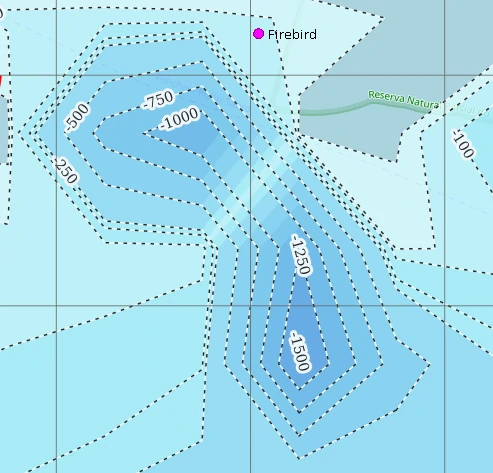
Be aware that processing lines and contours with gdal_contours do not always come to the same results:
GEBCO 2019
The GEBCO 2019 dataset is now placed in the "public domain", but please read the terms of use carefully.
Resultion is 15-arc now, which is about 460 m at the equator at sea level. Therefore the datasets are not suitable for visualisation at large scales.
According to Tobler´s rule: Map Scale = Raster resolution (in meters) * 2 * 1000 = 1:920.000 (Zoom Level 9)
Download GEBCO 2019 derived raster classification
Download GEBCO 2019 derived contour lines
Attributation: Derived product from the GEBCO 2019 Grid, made with NaturalEarth by OpenDEM
Processing Raster Clasification
The original GEBCO dataset was reduced to integer values with gdal_translate -ot Int16 and then classified with GRASS GIS r.reclas. See the parameters at the bottom of this page. The dataset was clipped with gdalwarp -cutline to the Ocean dataset from Natural Earth.
Processing Contour Lines
The original GEBCO dataset was reduced to integer values with gdal_translate -ot Int16. Contours were derived with gdal_contour. The dataset was clipped with ogr2ogr –clipdst to the Ocean dataset from Natural Earth. For performance reasons the countours were split with the QGIS SAGA tool Split line with lines in a 10 degree fishnet.
Be aware that the ogr2ogr clipping is a litte tricky (see that post). Successful was this command:
ogr2ogr -nlt LINESTRING -skipfailures -spat -90.0 -45.0 -45.0 -90.0 -clipsrc -90.0 -45.0 -45.0 -90.0 output.shp input.shp
You can see the visualisation of the datasets here. There is also a WMS available:
https://www.opendem.info/geoserver/opendem/wms
Layers: opendem:gebco_2019_contours & opendem:gebco_2019
The first Class -1 to - 25 metres is there not rendered, because there were to much intersections with the applied Natural Earth countries. When a raster is clipped with gdalwarp -cutline the cell is clipped when the center point of the cell is within the polygon. Therefore still intersections with the land tiles can occur.
GEBCO 2014
The data was derived for OpenSeaMap from the GEBCO_2014 Grid, version 20141103 www.gebco.net, and has use limitations:
"Use of the printed map and/or digital imagery for scientific research, environmental conservation, education or other non-commercial purposes is authorised without the prior permission of the data set originators, providing the source material is properly credited."
Please credit the source properly.
The resolution of the GEBCO 2014 dataset is 30-arc seconds.
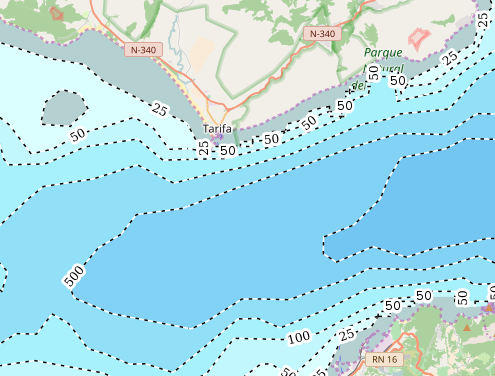
Fig. 1: Strait of Gibraltar with the downloadable bathymetry data. OSM tiles as background.
A bicubic interpolation of the gebco data was done by the factor 3.
The data was clipped with the OSM landtiles to avoid overlapping.
The data was classified on base of the depth values:
-1 thru -24.99 = 1
-25 thru -49.99 = 2
-50 thru -99.99 = 3
-100 thru -249.99 = 4
-250 thru -499.99 = 5
-500 thru -749.99 = 6
-750 thru -999.99 = 7
-1000 thru -1249.99 = 8
-1250 thru -1499.99 = 9
-1500 thru -1749.99 = 10
-1750 thru -1999.99 = 11
-2000 thru -2499.99 = 12
-2500 thru -2999.99 = 13
-3000 thru -3499.99 = 14
-3500 thru -3999.99 = 15
-4000 thru -4499.99 = 16
-4500 thru -4999.99 = 17
-5000 thru -5499.99 = 18
-5500 thru -5999.99 = 19
-6000 thru -6499.99 = 20
-6500 thru -6999.99 = 21
-7000 thru -7499.99 = 22
-7500 thru -7999.99 = 23
-8000 thru -8499.99 = 24
-8500 thru -8999.99 = 25
-9000 thru -9499.99 = 26
-9500 thru -12000 = 27
Polygons were computed and splitted for a better performance.
Contours were derived.