OpenDemTracker App (Beta)
About
GPS tracking and height recording based on the barometric sensor of your mobile device.
For this app, a GPS receiver and a barometric sensor are required.
An Internet connection is required when:
- the recorded data should be published under the Open Database License (ODbL) on the OpenDEM server.
- weather stations should be used as reference for correction of the data*.
- a SRTM elevation service should be used for the computation of the initial height value.
*Only available for Germany and the surrounding area. For more information, see here.
Nevertheless, you could use the data of this app for post processing at any place on Earth. The recorded data could be saved directly on your mobile device.
Be aware that this is an app with experimental status. With the present reference data of the weather APIs, it is not possible to create a reliable correction of the data over longer time periods. See here for further information.
Nonetheless, the first 10 minutes of every recorded track could be a starting point to build up an OpenDEM. But be aware that there are a lot of circumstances which could lead to improper results.
Download beta Version
Works with Android 4 KitKat
There are some bugs with more modern Android versions.
The Eclipse Project of the app can be downloaded here. The code is under the unlicense license, so do what you like.
The beta version of the app is available in the Google Play Shop: https://play.google.com/apps/testing/info.opendem.opendemtrackerThe .apk is available here.
Instructions
Lets see how it works. Have a look at the main view on your mobile device in tabularised form:
| initial latitude | ||||
| initial longitude | ||||
| height input type | ||||
| insert actual height [___] | ||||
| start | save | map | exit | help |
| status | ||||
First, insert your actual height at the starting point into the edit textbox "insert actual height".![]() If you do not know the actual height at your position you could also press the "start" button and use a web service for height calculation. The service is provided by mapzen on the basis of SRTM data. SRTM measures the Earth´s surface (including buildings and trees) and has an RMS error of +- 7 m. If an Internet connection is not available or the web service is not able to calculate a height value, the GPS height is taken as the height input.
If you do not know the actual height at your position you could also press the "start" button and use a web service for height calculation. The service is provided by mapzen on the basis of SRTM data. SRTM measures the Earth´s surface (including buildings and trees) and has an RMS error of +- 7 m. If an Internet connection is not available or the web service is not able to calculate a height value, the GPS height is taken as the height input.
Press "start" after you edit the actual height from whatever source.
It takes some time for the mobile device to fix the actual GPS coordinates. You get the following message in the status field: "Please wait while fixing the initial GPS position!". Please do not change your position until the coordinates are fixed. Otherwise, your inserted height will not fit to the fixed coordinates. After fixing, you get a message in the status field "Logging data". The accuracy of the GPS position could be poor (GPS accuracy is also logged). If there is temporarily no GPS signal, the app will not log and wait for the next signal.
The aim of the project is to generate a Digital Terrain Model (DTM). Please do not record tracks along man-made objects like bridges, houses, or elevated railways. Dykes and railroad embankments are usually part of a DTM.
The actual pressure of the German weather service (Deutscher Wetterdienst) will be requested for the actual pressure at the next weather station. Every 10 minutes the service will be requested. Unfortunately, the update interval is about half an hour and sometimes there are errors or non-values for the actual pressure. This is corrected in the historical datasets, which could be used for post-processing. Nevertheless, pressure could change at small scales, and there is no guarantee that the corrected heights are better. Be aware that the DWD data are copyrighted (see here).
Save your data
By pressing the "save" button, a dialog opens where you could enter a name under which the data will be saved.
| [filename] |
| Save only on device |
| Save on server |
| Save on Device and Server |
| I agree that the stored data on the server will be published under the Open Database Licence (ODbL). No personal data are stored! Uploading and processing on device could take several minutes! |
Edit the filename in the edit textbox "filename" if you want to store the data on your mobile under a unique filename. If your mobile is offline, only saving on the device is available.
When saving the data on the OpenDEM Server, you agree that the data is stored under the Open Database License (ODbL). No personal data like your call number or IP are stored.
Please be aware that it takes some processing time when the data are saved on the device. The upload on the server could also take some time depending on the amount of data and the digit rate.
Additional information about the processing, stored data und project is available on this website.
Your data are processed on the fly and are available in the a mapclient afterwards.
Stored metadata on device: yourChoosenName_meta.csv
| Header | Example | Description |
| date | Sun Nov 22 14:47:38 MEZ 2015 | Timestamp |
| sensor | BMP180 Pressure sensor | Sensor Model |
| mobileModel | Galaxy Nexus | Mobile Model |
| mobileProduct | yakju | Mobile Android Version |
| weatherApiStation * | EDDK | Weather Station of the DWD |
| weatherApiLat * | 50.87953258305788 | in decimal degrees |
| weatherApiLon * | 7.121004089713097 | in decimal degrees |
| weatherApiDistance * | 3058.53 | in metres |
| enteredHeight | 50.0 | in metres |
| heightInputType | manual | manual, service (SRTM) or GPS |
| uuid | 1e9b38fe-5ac4-4f8f-aac3-f8e44a7a0927 | uuid of the track. with this uuid you can find your track in the map and data download. |
| corstate | dwd* | different states of correction will follow, including post-processing |
Table 1: Metadata saved on the device
* Makes sense only in Germany, see the station description. Copyrighted data by DWD.
Stored data on device: yourChoosenName.csv
| Header | Example | Description |
| id | 1 | serial |
| time | 11:23:47 | hh:mm:ss |
| lat | 50.95803040545434 | Latitude in decimals |
| lon | 7.013039728626609 | Longitude in decimals |
| gpsAccuracy | 35.0 | in metres |
| pressureWApi * | 1012.6 | at mean sea level |
| pressureCor ** | 1004.77 | mean pressure of the last 20 values and filtered (see below) |
| pressureFilter ** | 1004.8 | outliers of sequence values +- 0.2 hPa filtered out |
| pressureRaw ** | 1004.96 | raw pressure values |
| height | 50.0 | in metres |
| heightCor* | 51.9 | in metres, corrected with reference values |
Table 2: Data saved on device
* Makes sense only in Germany, see the station description. Copyrighted data by DWD.
** pressure measured at device, not at mean sea level
Stored pressure values on device: yourChoosenName_pressure.csv
| Header | Example | Description |
| date | 11:23:47 | time |
| pressure | 1004.85 | pressure (on device, not at mean sea level) |
Table 3: All saved pressure values. Only available on the device for research.
All pressure data are the pressure recorded at the device, not at sea level! But it is easy to approximately compute the hPa at mean sea level (see Table 5) if the height is known.
See here for the data saved on the server that is ready for download.
Processing
There are about 14 records per second for the pressure recorded by the device ("SENSOR_DELAY_FAST" = 0.05 per sec). When the GPS is fixed the mean of the last 20 recorded pressure values is computed. If there are values that are > +- 0.1 mbar of the mean, these values are filtered out, and the mean is computed again.
To avoid outliers, only values that do not differ by more than 0.2 mbar of the last recorded value are taken into account (about 1.6 m in < 0.01 seconds). This was never the case with the BMP180 pressure sensor. But there are other sensors, and I had some problems with outliers with my Garmin GPS. This was done for the values "pressureFilter" and "pressureCor".
The values of the sensor are scattering. Below is the scattering around the mean value in red computed from 831 values recorded in 2 minutes.
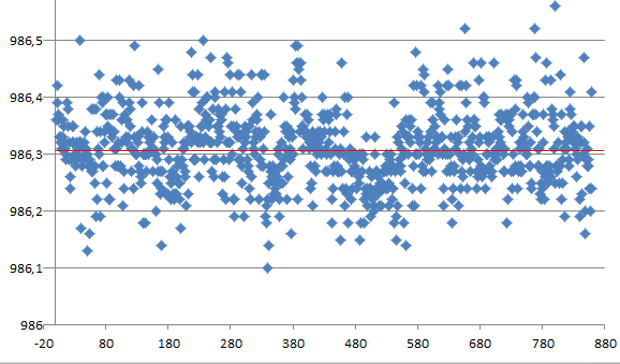
Fig. 1: Scattering of the pressure values (y axis) around the computed mean in red from 831 values recorded in 2 minutes.
For "pressureCor" the mean of the last 12 recorded values was computed (see Table 4). We always have a scatter of the pressure values, even with the mean filter.
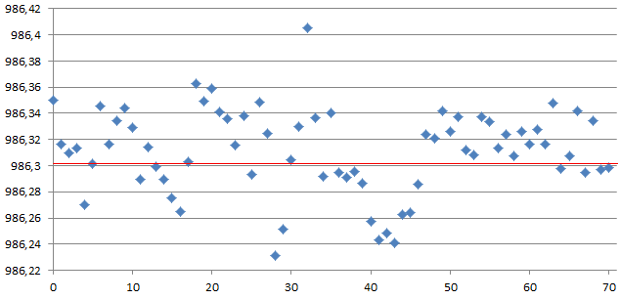
Fig. 2: Scatter of the recorded values with the pressure sensor "BMP180" after computing the mean of the last 12 values.
As seen in Figure 2, there is still a scatter with a mean value of about +- 0.025 hPa (0.2 m at sea level), even after the correction.
| SENSOR_DELAY_NORMAL | SENSOR_DELAY_UI | SENSOR_DELAY_FASTEST | |
| Delay (sec) | 0.2 | 0.06 | none |
| Measurements per sec | ~3 | ~ 10 | ~14 |
Table 4: Android sensor delay parameters compared to the amount of real measurements
The sensor parameter "SENSOR_DELAY_FASTEST" is used to achieve optimal results.
| n | deviation from mean [hPa] |
| 12 | 0.025 |
| 6 | 0.027 |
| 3 | 0.323 |
There is a rule of thumb that was used to correct the heights, which is acceptable for heights less than 6 km (mean sea level):
Barometric scale factor = 8 + height in km (mean sea level)
| height (mean sea level) | barometric scale factor |
| 0 | 8 |
| 100 | 8.1 |
| 500 | 8.5 |
| 1000 | 9 |
| 2000 | 10 |
When saved on the server, you find your track under the uuid in your local metadata.csv in the map and data download.
Map Button
An OpenLayers map client will open in your favorite Browser. After you accept to locate your location, the map will be centered with Web Mercator zoom level 15. If not, the location the map will be centered at lat/lon 0/0. The tracks and overviews will be draped on the OSM map tiles.
Exit Button
Exit the app. The app is still available in the tracklist, but will not allocate any resources.
Help Button
Get some information about the app and give some feedback.