Height measurements with app and barometer
The idea of this project was to develop an android app for mobile devices with integrated barometers. The measurements of the app should be corrected with external reference data on the fly (see also here).
A beta version of the app is now available in the google play store:
https://play.google.com/apps/testing/info.opendem.opendemtracker
There are a lot of Weather APIs available that could be used as a reference, such as the OpenWeatherMap API or Wunderground API. Unfortunately, no API is available that matches the desired criteria:
- Update interval of the pressure about 10 minutes
- Dense network of weather stations
- Accuracy of the pressure value with at least one decimal (about 80 cm at mean sea level - MSL)
UPDATE! Check out the Top 8 Weather APIs for 2020
Even with the public data of the German weather service (Deutscher Wetterdienst) it was not possible to create reliable height measurements for Germany. The data are updated only every half hour, and the pressure could change significantly in this period (see Figure 1).
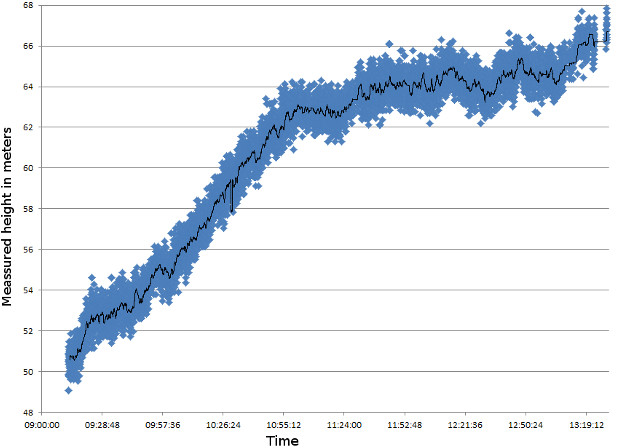
Fig. 1: Measured heights with the app over time at a stationary place at 50 m height mean sea level (date: 1.1.2016)
From 10:00 to 11:00, we find a more or less linear relationship of the values. This data could be easily corrected with an interpolation. If we have measurements for the reference station only at 11:00 (63.3 m), 12:00 (64.5 m) and 13:00 (64.3 m), we are missing a lot of ups and downs between these points in time (see Figure 1). This results in improper correction values. Therefore an updated interval of the reference data of at least 10 minutes is desirable.
| WeatherAPI | Accurracy Pressure | Update Interval |
|---|---|---|
| OpenWeatherMap City | Integer | 3 hours |
| OpenWeatherMap Stations | Integer, decimal | Many stations are not updated within weeks (around Cologne). No information about the last measurement. |
| Weather Underground | Integer, even for the airports | Depends on the station, often < 10 min |
| Deutscher Wetterdienst | Decimals | Every half hour |
Table 1: Accuracy regarding the pressure and update interval of available Weather APIs. Integer means millibars with no decimals. Accuracy for 1 millibar = 8 m at mean sea level.
UPDATE! The problem has beencommunicated to the wunderground.com development team.
 Decimals for the pressure values may be available in a future API. Thank you for the responses!
Here is an example response for an OpenWeather API request in JSON format:
{"station":{"name":"rvb.name","type":5,"status":1,"user_id":15032,"id":80678,"coord":{"lon":37.5617,"lat":55.4033}},"distance":57.285,"last":{"main":{"temp":274.25,"humidity":90,"pressure":975.2},"dt":1422725182}}
The timepoint of the last measurement is unfortunately not committed. Some stations in the surrounding of Cologne were not updated for weeks.
Here is a subset example response for a WunderGroundAPI API request in JSON format:
"station_id":"IKLN441", "observation_time":"Last Updated on February 13, 9:26 AM CET", "observation_time_rfc822":"Sat, 13 Feb 2016 09:26:46 +0100", "observation_epoch":"1455352006", ... "pressure_mb":"993", ...
The last update time is available, but the pressure is not given in decimals.
Even the weather for the airports on the NOAA website is only updated every hour. Sometimes the data are updated even later, or not available for some instruments. But this is corrected in the historical data on the next day. The historical data (delay of 12 hours, last 500 measurements, half-hourly) for Germany could be accessed via the DWD website here. Since January 2016 the data of the DWD are updated half-hourly.
Beside that there are also strong local changes regarding the pressure. A solution could be a post correction with interpolated pressure maps. This would also lead to better results if the pressure at the reference station would be interpolated between time intervals via post-processing.
Also other conditions could lead to improper results:
- relief, e.g. at the
windward and leeward side of mountains
- atmospheric instability, e.g. thermal bubbles
- deviations from the standard atmosphäre, e.g. important for the calculation of the barometric scale factor
Conclusion: With the present reference data of the weather APIs, it is not possible to create a reliable correction of the data measured with the android app. Nevertheless, perhaps wunderground.com will support more precise pressure information in the future, or perhaps someone has another idea for corrections. Meanwhile, the first 10 minutes could be a starting point for an OpenDEM (see results below). But be aware that there are a lot of circumstances which could lead to improper results.
Any ideas? Mathematicians, meteorologists, or physicists out there, here are some test data. All data were recorded at the same place with a height of 50 m mean sea level. Additional historical weather parameters could be retrieved from the DVD site (pressure is already included for the next station). It would also help to find a correlation with other weather conditions (wind speed, temperature, etc.) to retrieve information about the quality of the pressure data between two points in time.Manual correction: the most accurate choice
Another mobile or GPS with barometric sensor could be used as a reference for self-made corrections. In Figure 2 below, a Garmin GPS was used as a reference station to correct the height measurements recorded with the app.
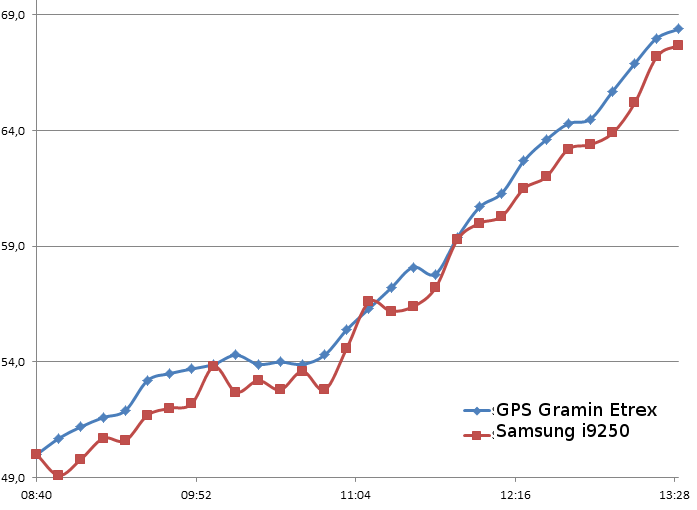
Fig. 2: Stationary measurements of a Garmin Etrex Vista HCX (red squares) and a mobile Samsung i9250 (blue rhomb) (recorded 5.2.2016 08:40-13:30, y-axis in meters).
After the correction a RMS below 1.2 meters could be archived with the Garmin GPS as reference station. The measurements were recorded stationary at 50 m MSL. Both devices were of course calibrated to 50 m MSL before.
Use the available manual correction online tool on this website to correct your data now!
Below you see a correction done with the tool.
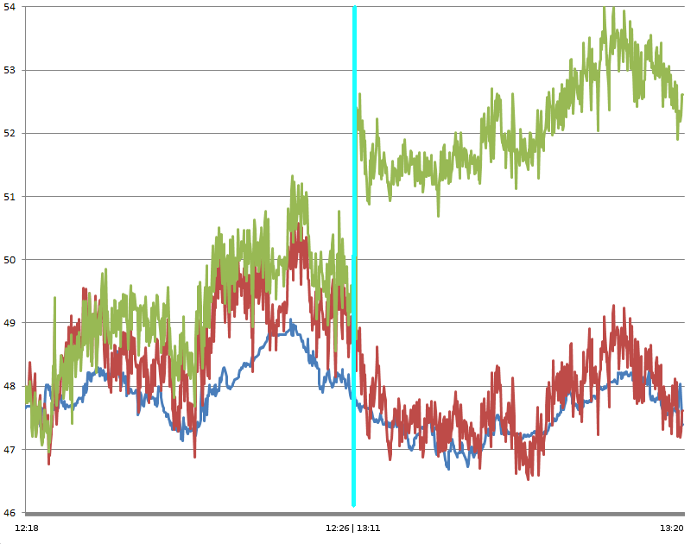
Fig. 3: Correction of an OpenDemTracker Track with GARMIN Etrex GPS data done with the OpenDemTracker correction online tool. Blue line: official reference data, green line: OpenDemTracker data, red line: OpenDemTracker data after the correction. A gap in the recording occur because of lacking reference data between 12:26 and 13:11 (cyan line)
While recording the track (Figure 3) the pressure increases at the Garmin reference GPS from 48.7 to 54.2 metres. This results in an total mean deviation from the official reference data of about 4.68 metres (green line). After the correction with the tool the total mean deviation from the official reference data was about 0.37 metres. There was an an leap in time between the GPS and the device of a two hours. This could be also be manually adjusted with the online correction tool.
Beside a GPS or mobile with barometer as reference, also single board computers like the Rasperry PI or Andurio with barometric sensors could be used. Bosch made some real good barometric sensors. The MS5803-01BA is the newest generation currently (stand 2/2016) with 10 cm resolution. Combining two single board computers with GPS and temperature sensors could lead to results in decimetre range. Warning! High resolution pressure measurement would only make sense with improved GPS accuracy (see below).
Typical problems when recording
As seen in the figure 3 below the accuracy of the height typically decreases with time. The measured pressure at the next DWD station rises from 9:00 to 9:30 from 1018.0 to 1018.3 hPa in this time period.
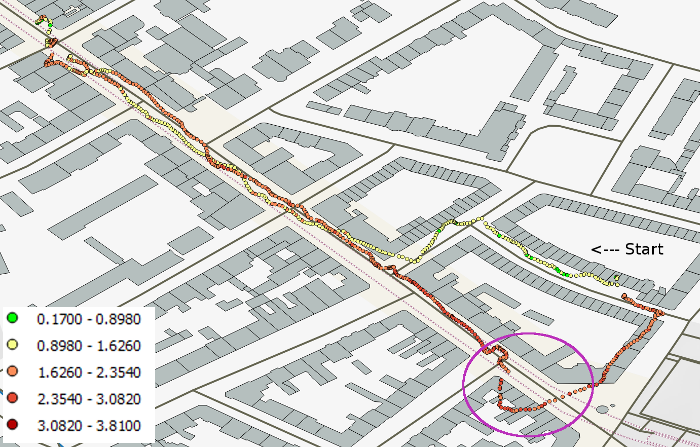
Fig. 4: Track of about 16 minutes in counter-clockwise direction from the starting point (9:16-9:32). The legend shows the deviation from official reference data in metres.
In the magenta circuit area are typical strong, short deviations of the GPS coordinates along a track. Post-processing could lead to better results. The GPS accuracy is also logged in the data. Usually the GPS accuracy is the real problem regarding the overall accuracy. Perhaps in the future some DGPS techniques like in the RTKGPS+ app could be included to achieve better results.
Results
Figure 5 shows over 5900 recorded trackpoints from the first 10 minutes of every track. The test area is in Cologne Germany.
![]()
Fig. 5: Recorded first 10 minutes of any track in the test area of Cologne, Germany, draped over the OSM map. The colour of the trackpoints corresponds to the deviation from the reference DTM (legend on the left in metres).
| tracks | 15 |
| test area | Cologne Germany |
| recording period | 29.5.-30.5.2016 |
| trackpoints | 5916 |
| reference min height [m] | 38.98 |
| reference max height | 51.67 |
| max height differnce [m] | 5.88 |
| rms height [m] | 0.83 |
Table 2: Statistics of the recorded trackpoints in comparison to a 1 m DTM reference dataset.
The largest deviations often occur next to man-made objects like railroad embankments (figure 6).
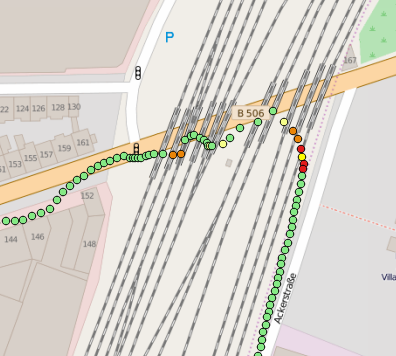
Fig. 6: Deviations of the trackspoints height values next to man-made objects like railroad embankments (draped over the OSM map - legend, see Figure 4).
The error here is caused by the insufficient accuracy of the GPS coordinates. This error would increase in mountainous areas.
The changing weather conditions did not have a significant effect on any of the recorded tracks for the first 10 minutes. There was a lot of change in the test period, as seen in Figure 7.
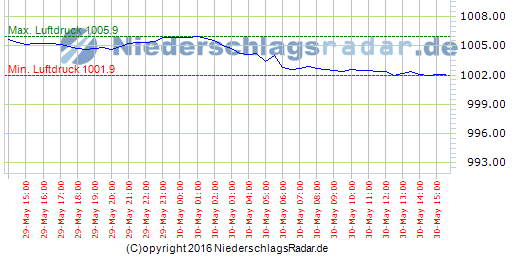
Fig. 7: Pressure over time (blue line) in the test period (© by Niederschlagsradar.de).
Conclusions
The results for the first 10 minutes of every track look very promising with an RMS error below 1 m. Unfortunately, it is a time-consuming job to calibrate your mobile device every 10 minutes.
The challenge would be to find global corresponding reference data and the correction of the GPS coordinates.